A Brief Introduction to Unsupervised Learning
A Brief Introduction to Unsupervised Learning
Summary: In this post I will discuss the details of unsupervised machine learning and its applications. Code examples will be shown to demonstrate certain techniques.
Unsupervised learning is a branch of machine learning that is used to manifest underlying patterns in data and is often used in exploratory data analysis. Unsupervised learning does not use labeled data, but instead focuses on the data’s features. Labeled training data has a corresponding output for each input. When using unsupervised learning, we are not concerned with the targeted outputs because making predictions is not the desired outcome of unsupervised learning algorithms. Supervised learning is concerned with labeled data in order to make predictions, but unsupervised learning is not.

The goal of unsupervised learning algorithms is to analyze data and find important features. Unsupervised learning will often find subgroups or hidden patterns within the dataset that a human observer may not pick up on. This is shown in the figure above. With the given image, any human can pick out the subgroups, but with a more complex dataset, these subgroups may not be so easy to find. This is where unsupervised learning can help us.
Clustering
Clustering is the simplest and among the most common applications of unsupervised learning. Clustering aims to discover “clusters”, or subgroups within unlabeled data. Clusters will contain data points that are as similar as possible to each other, and as dissimilar as possible to data points in other clusters. Clustering helps find underlying patterns within the data that may not be noticeable to a human observer.
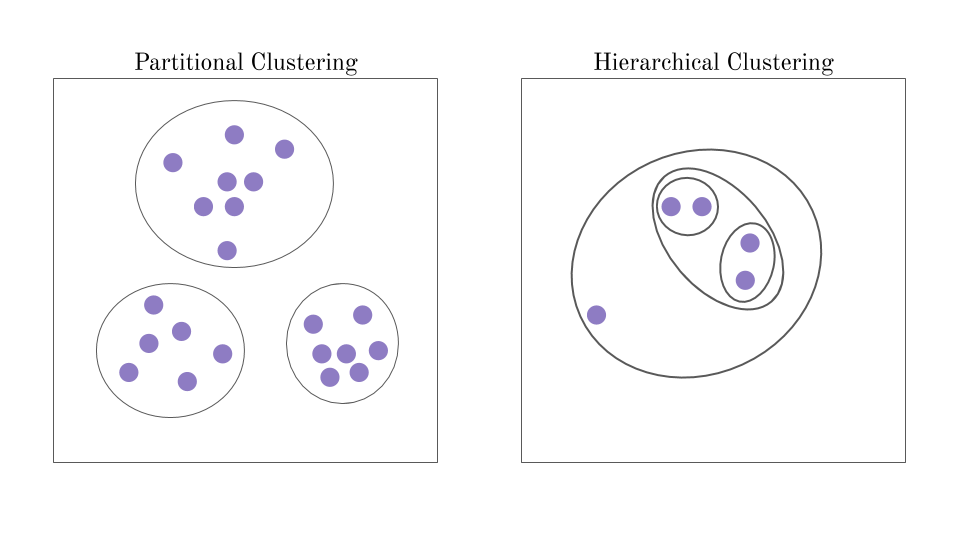
The two basic types of clustering that will be covered are partitional clustering and hierarchical clustering.
Partitional Clustering
Partitional clustering refers to a set of clustering algorithms where each data point in a dataset can only belong to one cluster. An example of this would be the k-means algorithm.
In k-means clustering, the goal is to partition, or divide, the data into a predetermined value for K, the number of clusters. Each data point will fall into only one cluster of the K clusters, and therefore the clusters will not overlap like they would in hierarchical clustering.
Hierarchical Clustering
Hierarchical clustering finds clusters by a system of hierarchies. Every data points can belong to multiple clusters, some clusters will contain smaller clusters within it. This hierarchy system can be organized as a tree diagram. Hierarchical clustering can be done in two ways: top-down (whole cluster to single points), or bottom-up (single points to big clusters).
-
Agglomerative algorithms will find clusters with a bottom-up approach. These algorithms start with each data point as a cluster, then progressively “zoom out” and combine smaller clusters into larger clusters.
-
Divisive algorithms take the opposite approach: top-down. Divisive algorithms start out by looking at the entire dataset as one cluster, then “zooming in” to divide the dataset into smaller clusters.
Unlike k-means clustering, with hierarchical clustering, the number of clusters in unknown beforehand.
Partitional Example - K-Means
Below is an example of k-means clustering using scikit-learn, a high level machine learning library for Python.
First, we must import the necessary imports. Using scikit-learn allows us to import “make_blobs” to create multiple data points to use for our clustering algorithm. Scikit-learn also allows us to simply import the k-means algorithm.
from sklearn.datasets import make_blobs
from sklearn.cluster import KMeans
Using “sklearn.datasets.make_blobs”, we can create example data points. The number of points will be set to 1,000. Our data points will be equally divided and centered around 3 areas, this means we should need to find three main clusters when we apply the k-means algorithm. The cluster_std = 1.2 parameter will set the standard deviation of the clusters. The random_state parameter will make the data points consistent every time we run that line of code. This is useful when playing with parameters and comparing the end results.
We can then use Matplotlib, a Python plotting library, to plot the data points that we generated. We can set the edge colors and widths to make each point more visible.
# Create the dataset - Returns X, y or data[0], data[1].
# Dataset made by "make_blobs". Parameters are set.
data = make_blobs(n_samples=1000, centers=3, cluster_std=1.2, random_state=10)

# Setting scatter plot title.
plt.title('Data Points')

# Show the scatter plot of the data points.
plt.scatter(data[0][:,0], data[0][:,1], edgecolors='black', linewidths=.5);

plt.show()

It should be easy to visually pick out the three clusters that we want the algorithm to find.
We can now create the k-means algorithm and set the desired number of clusters to three, then we can train the algorithm on the data points we generated earlier. After training, we can call the “predict” function to solidify the algorithms decisions. Finally, we can plot the clusters just like we did before, but we can add a color sequence that will represent the clusters that were found.
# Creating algorithm and setting it's parameters.
K_Means = KMeans(n_clusters=3)

# Training - "Fitting to the data".
K_Means.fit(data[0])

# Make predictions.
clusters = K_Means.predict(data[0])

# Setting scatter plot title.
plt.title('Data Points in Clusters')

# Show scatter plot - The color (c) is determined by the clusters.
plt.scatter(data[0][:,0], data[0][:,1], c=clusters, edgecolors='black', linewidths=.5)

plt.show()

It looks like the k-means clustering algorithm did pretty well!
References:
MIT 9.54 Class 13, Unsupervised Learning: Clustering
David Arthur and Sergei Vassilvitskii: Clustering: Partitional Clustering